
Tutorials
Data Driven Bar Chart Race in After Effects
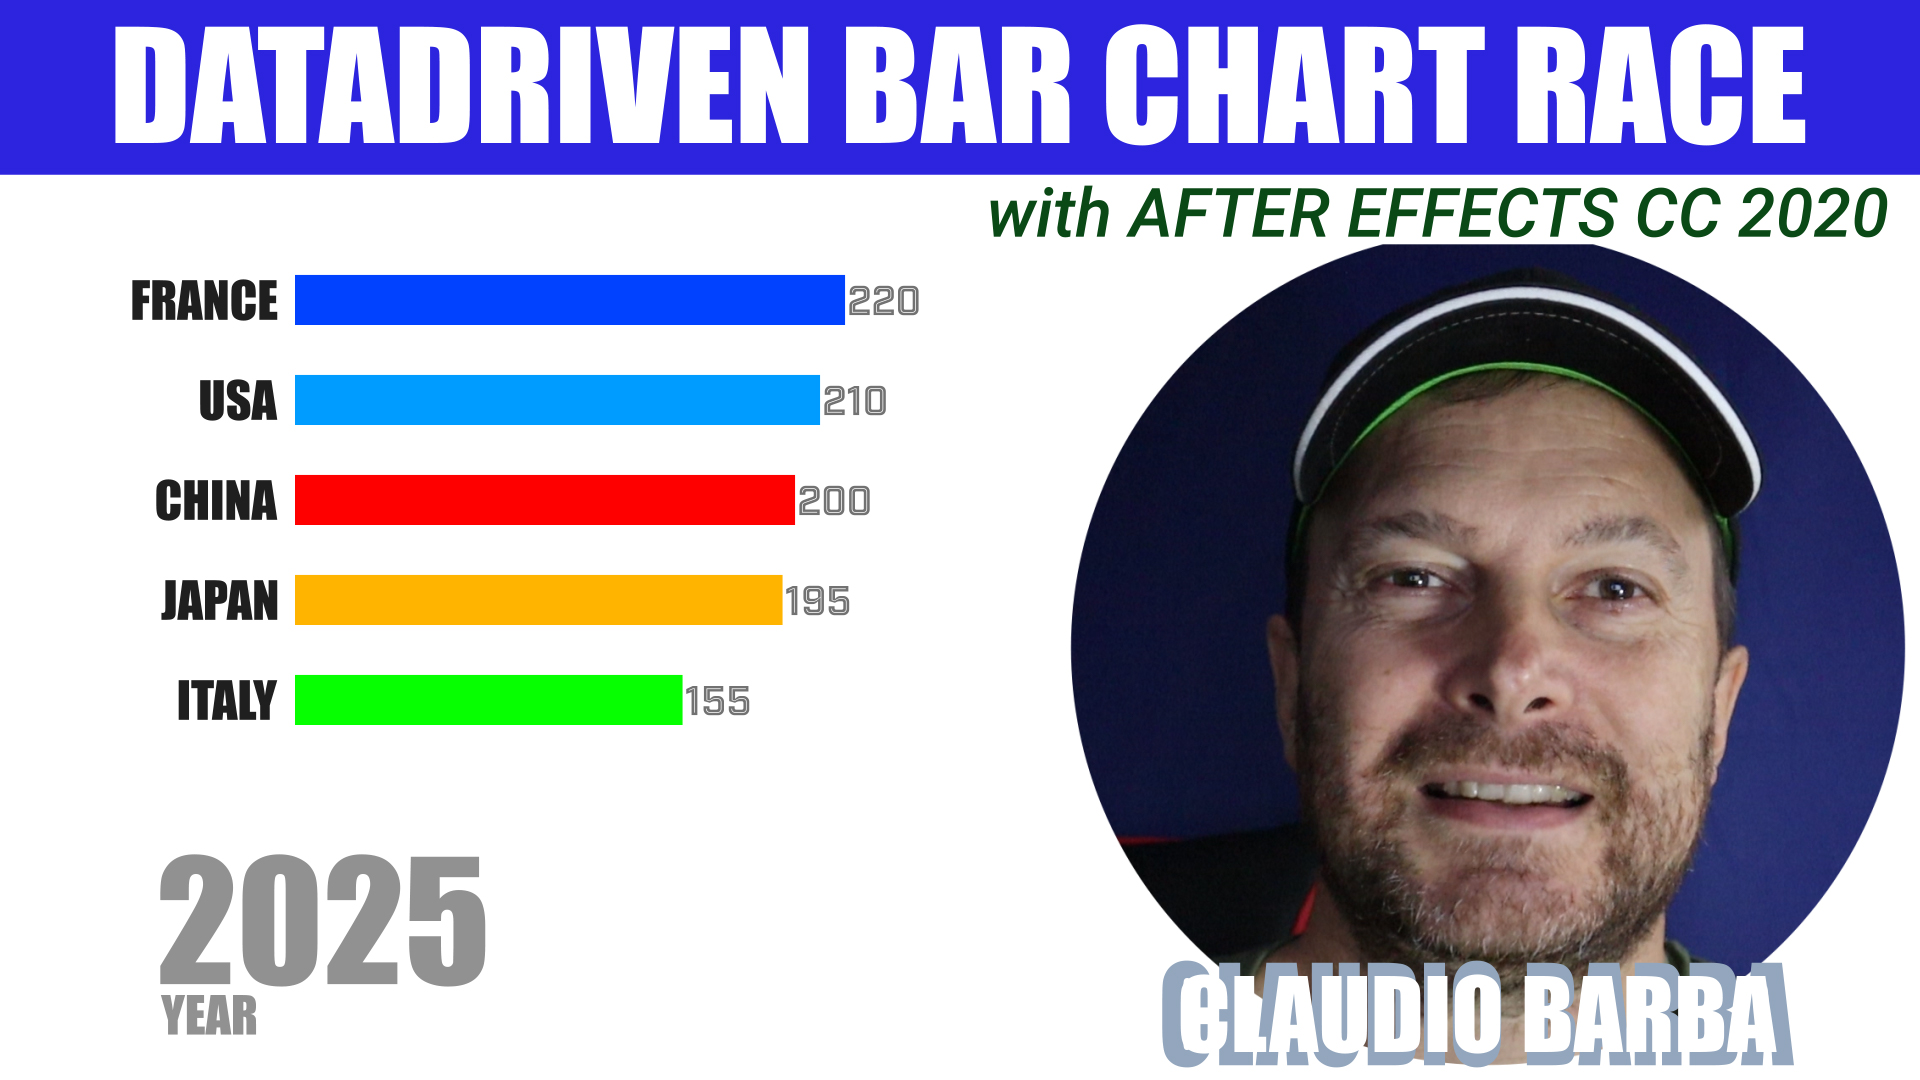
Hi Guys, last week we have imported a csv file in After Effects and used it to create an animated bar chart. Well, that was not enough, so today I am going to show you how to use expressions to move the bars depending on their value and create a real, data driven, Bar Chart Race ! Of course I am going to let you download the project. My name is Claudio Barba and I welcome you on my Motion Design channel!
So, what is new this week? First of all, I have introduced a main control layer, with the main parameters. It contains the number of data rows of the CSV file, the number of rows, and the colors associated with each column in the bar chart.
Please Subscribe to my Email List to get the Free Project. I will just send a newsletter every now and then about the latest offers of my scripts for After Effects and other free After Effects or Premiere Pro Content!
You can download the Sample Data Driven Bar Chart Race project for After Effects here 🙂
You can get the Complete SCRIPT Version of BARBACHART – Bar chart race for after effects here: https://claudiobarba.gumroad.com/
The main Control layer is called CTRL. It contains some sliders and color picker effects for the initial setup. Lines is the total number of data rows in the CSV file, excluding the titles, Columns is the total number of columns (all included). If After Effects is showing some expressions errors, you might have to put the correct numbers on these sliders.
For each bar, we need four layers, for instance for the first one we need:
- 1: this is the rectangle shape layer
- v1: this is the current value shown on the right of the rectangle
- t1: the label of the chart, on the left side, which corresponds to the name of the column in the CSV.
- c1: this is the control layer of the bar. The main calculations are contained here on the sliders. We have the interpolated current value, the current and following value in the table, and finally the current and following position of the bar, as the bar are interchanging their position, ordered by value descending.
Every time we need to add a column, we just need to
- add the column in the csv file, which is linked to the project
- duplicate this set of 4 layers, respecting the naming convention
- modify the lines value in the main control layer.
If you still think that this is not really something you can do in After Effects, you might want to try dynamic animated charts on Flourish or similar paying solutions.


Are you ready to level up your Motion design game? Well, buckle up, because I’m going to show you a game-changer—the brand-new “2D Text Box (Mask and Effects)” preset!
No more hours of code, no more frustration, no more searching for outdated tutorials just to put a simple box around your text. This is the HUGE improvement we’ve all been waiting for, and it’s going to change the way you work.
It has been added to After Effects cc2024 in the last months, so you don’t have to pay anything more.. it’s part of your Adobe Subscription, together with the tons of other presets and effects.
How To Use the Text Box Preset
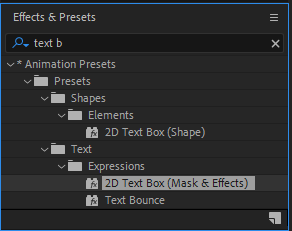
1. All you need to do is to Create a Text Layer with the text you need.
2. Then go to the Effects and Presets panel and look for: 2D Text Box (Mask and Effects)
3. Drag it over your text layer to apply it.
4. Edit the properties you want to change in the effects control panel.
The great news is that it is self adapting to the text. For instance, if you put a text animator on the layer, the text box will adapt to the content at each moment.
You can also change the Padding, the roundness and direction of the corners, even individually… so you can set a round corner on the top left, while keeping square corners on the others.
Of course each and every color is easily accessible in the effects properties panel, together with all the configurations for the fill and the lines.
Personally, I have always been using some of my expressions when I needed text boxes. Having a developer background helped me in the past.. but frankly, since when I discovered this new textbox preset, I have being using it almost exclusively!
This is THE tool motion designers have been dreaming of. You’ve got total creative freedom, and you can focus on what really matters—your design, not wasting time coding!
And that’s it! The brand-new “2D Text Box (Mask and Effects)” preset is here, and it’s going to change the way you work forever. Say goodbye to coding stress, and hello to creative freedom!
So, what are you waiting for? Go try it out and let me know in the comments how much time it’s saving you.

Adobe After Effects is a powerful software used by professionals and enthusiasts alike to create stunning motion graphics and visual effects. Once you’ve completed your masterpiece, the next step is to export it in a format that can be easily shared and viewed. In this tutorial, we’ll walk you through three methods of exporting your After Effects composition as an MP4 video: using the internal render queue, Adobe Media Encoder, and the aerender.exe command-line tool.
Method 1: Export mp4 video using the Internal Render Queue
Step 1: Prepare your Composition
Before exporting, ensure that your composition is set up correctly. Check the resolution, frame rate, and duration to match your desired output settings.
Step 2: Access the Render Queue
In After Effects, navigate to the top menu and select “Composition” > “Add to Render Queue” or use the shortcut “Ctrl + M” (Windows) or “Cmd + M” (Mac).
Step 3: Adjust Settings
In the Render Queue panel, click on “Best Settings” to open the Output Module settings. Choose “H.264” as the format, and then select “Format Options.”
Step 4: Video Settings
In the Format Options window, you can adjust video settings like codec, quality, and bitrate. For MP4, the H.264 codec is recommended for its broad compatibility and efficient compression.
Step 5: Audio Settings
If your composition contains audio, configure the audio settings under the “Audio Output” section.
Step 6: Choose Output Path
Select the destination folder for your exported MP4 video by clicking on the “Output To” option.
Step 7: Render the Video
Once you’re satisfied with the settings, click “OK” to return to the Render Queue panel. Finally, click “Render” to start exporting your After Effects composition as an MP4 video. The video will render, but you will not be able to use After Effects efficiently while it is rendering. If you need to use After Effects while you export the video as mp4, use the following method with Adobe Media Encoder.
Method 2: Export MP4 videos using the Adobe Media Encoder
Adobe Media Encoder is a software by Adobe that allows to render and convert video files in different formats. It can therefore very easily render an MP4 movie from After Effects.
Step 1: Prepare your Composition
Follow the same steps as Method 1 to prepare your composition for export.
Step 2: Add to Adobe Media Encoder Queue
Instead of using the internal render queue, you can send your composition directly to Adobe Media Encoder. Go to “Composition” > “Add to Adobe Media Encoder Queue.”.
Adobe media Encoder, or AME, might take some time to open, even some minutes.
Step 3: Choose Format
In Adobe Media Encoder, select the “H.264” format for MP4 video under the Format column.
Step 4: Configure Settings
Click on the “Preset” dropdown menu to select a preset that matches your requirements or customize the settings manually.
Step 5: Output Path
Choose the output path by clicking on the “Output File” option at the bottom.
Step 6: Start Encoding
Once you’ve configured the settings and output path, click the green play button to start encoding your After Effects composition into an MP4 video.
Method 3: Rendering Using aerender.exe
Step 1: Locate aerender.exe
The aerender.exe command-line tool is usually located in the “Support Files” folder within the After Effects installation directory.
Step 2: Open Command Prompt or Terminal
Launch Command Prompt (Windows) or Terminal (Mac).
Step 3: Navigate to aerender.exe
Use the “cd” command to navigate to the folder containing aerender.exe.
Step 4: Execute the Render Script
Enter the following command to execute the script and start rendering:
aerender -project path/to/your/project.aep -comp "Your Composition Name" -output path/to/output/folder -OMtemplate "H.264" -close DO_NOT_SAVE_CHANGES
Replace “path/to/your/project.aep” with the full path to your After Effects project, “Your Composition Name” with the name of your composition, and “path/to/output/folder” with the desired output path.
You can find detailed instructions here about Automated rendering and network rendering.
Exporting your After Effects composition as an MP4 video is crucial to showcase your creative work. In this blog post, we explored three different methods: using the internal render queue, Adobe Media Encoder, and the aerender.exe command-line tool. Each method has its advantages, so choose the one that best suits your workflow and needs. Whether you’re a seasoned professional or a beginner, these methods will enable you to share your After Effects creations with the world. Happy exporting!
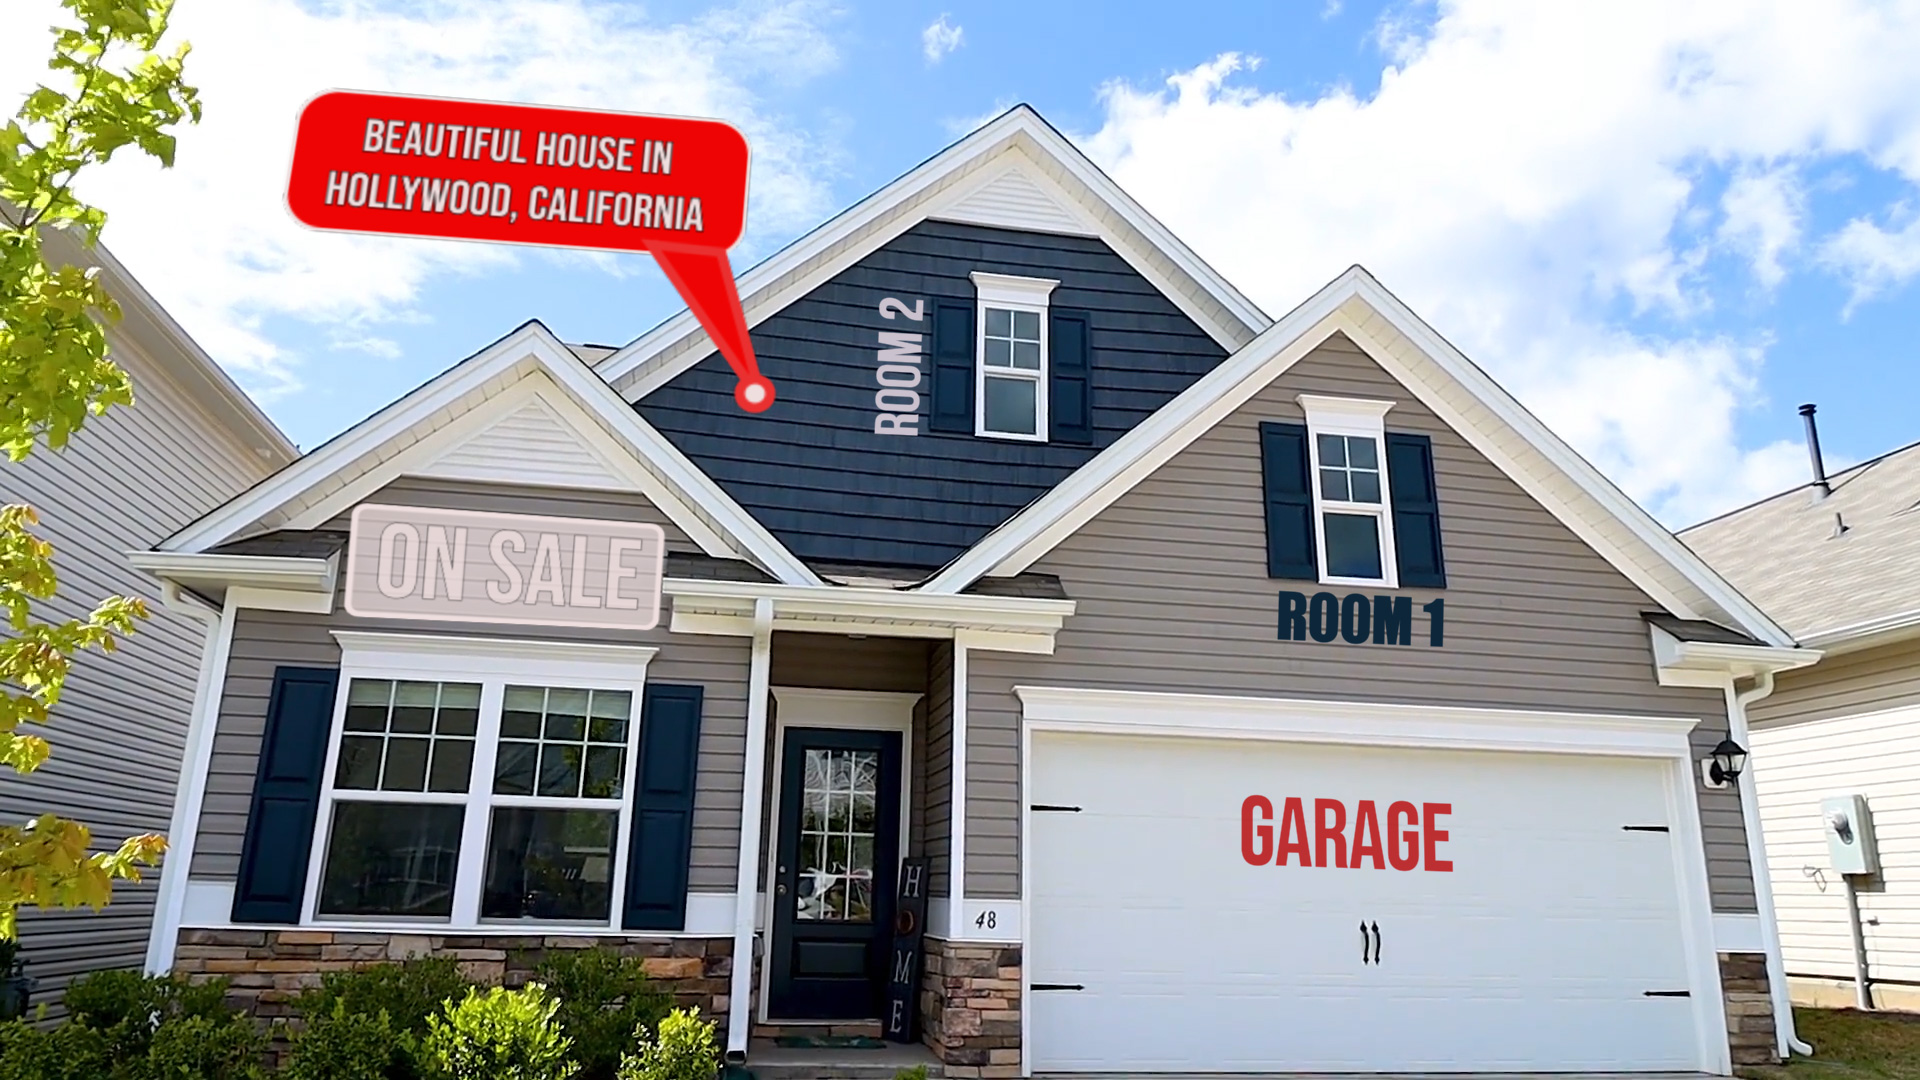
Let’s add some call-outs and some labels to your Real Estate Videos, so that you can tell what is what.
In this tutorial we will use the 3D Camera Tracker in Adobe After Effects 2022 and create an animated label linked to the house in the Video.
If you get lost, send me a message! I am here to help 😉
Watch the After Effects Tutorial!
#aftereffectsanimation #aftereffects #vfx #vfxjobs #vfxartist #realestate #realestatebranding #realestateagency #3dtracking #freelancework #cameratracking #video #help

-

 Motion News9 months ago
AFTER EFFECTS vs RIVE vs CAVALRY
-
 Motion News2 years ago
CapCut vs Premiere Pro: The Ultimate Video Editing App Showdown
-
 Tutorials3 years ago
How to track real estate and callouts in Adobe After Effects
-

 Motion News10 months ago
The New 2D Text Box Preset in After Effects
-
Tutorials2 years ago
How to export mp4 videos from After Effects | 3 methods to export
-

 Motion News10 months ago
Managing ADHD for Creative Designers
-
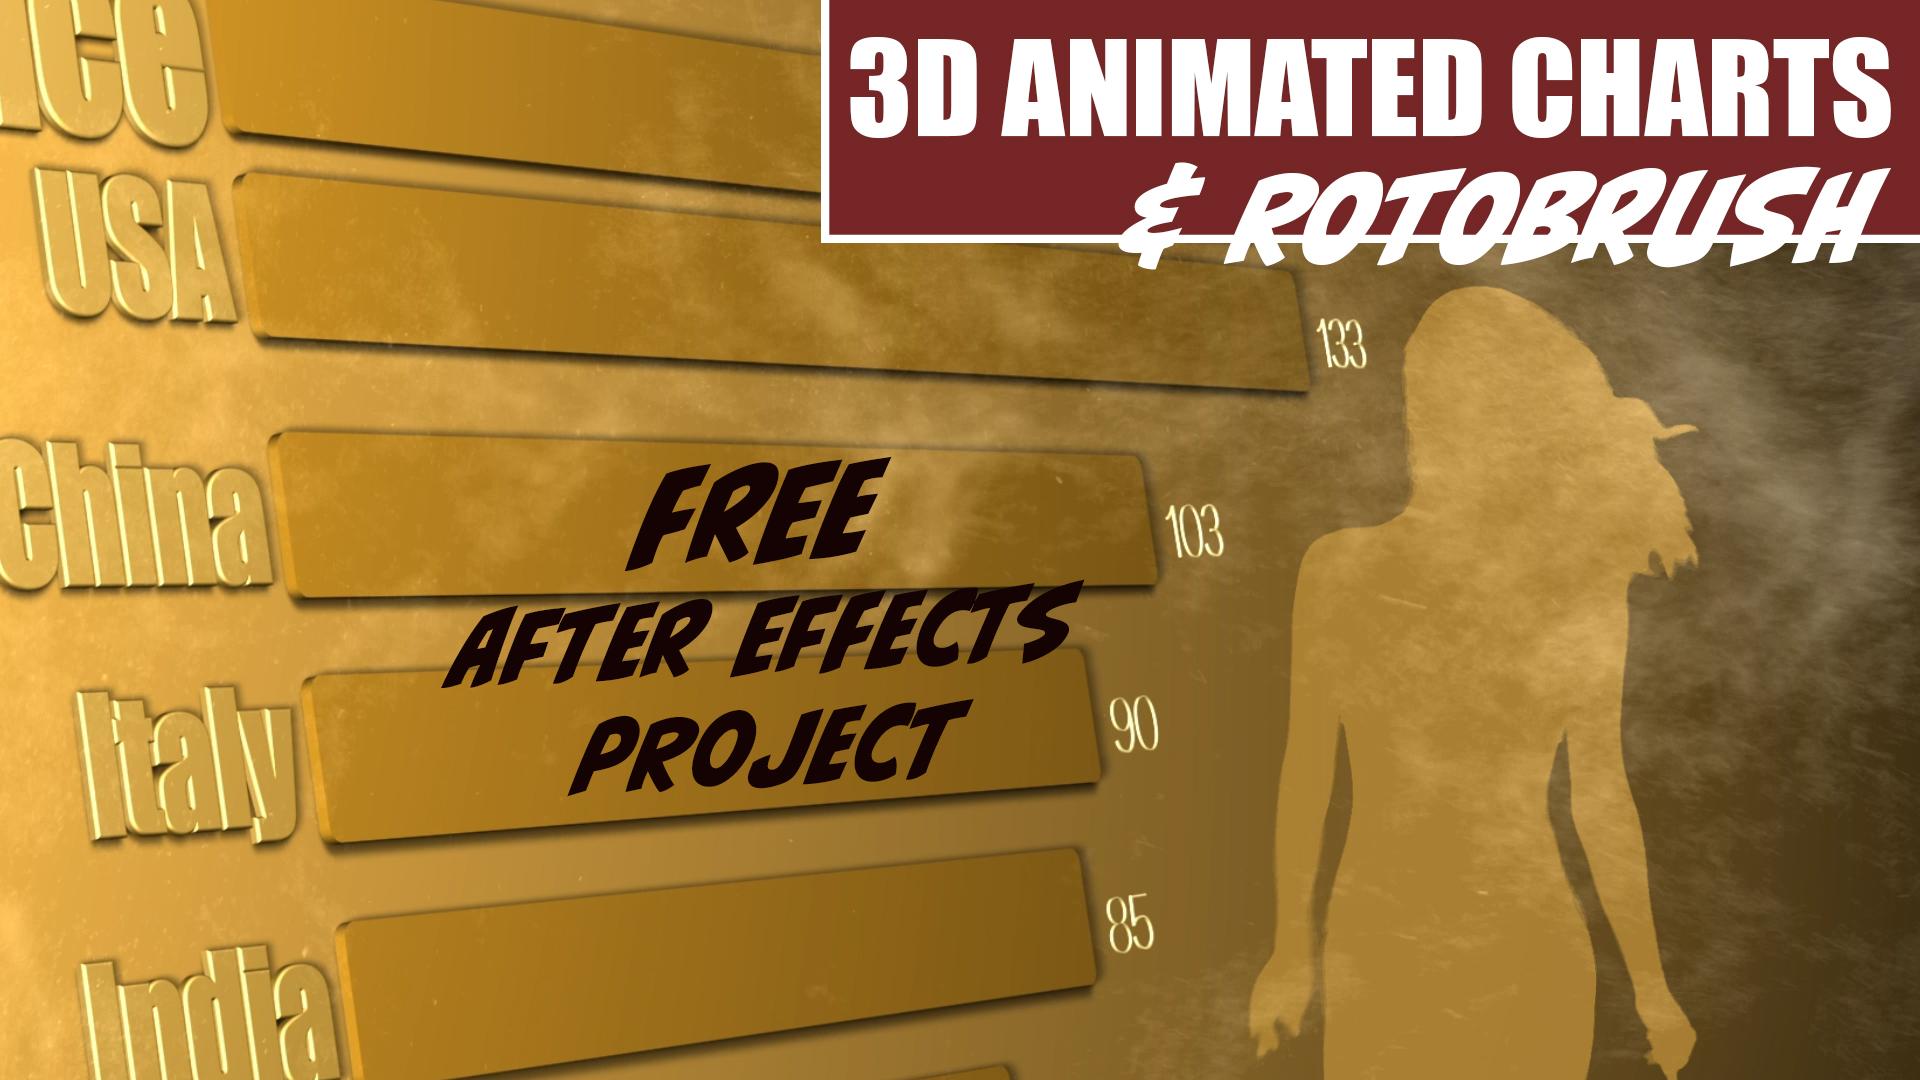 Tutorials5 years ago
3D Animated Infographics in After Effects and Rotobrush 2 Tutorial
-
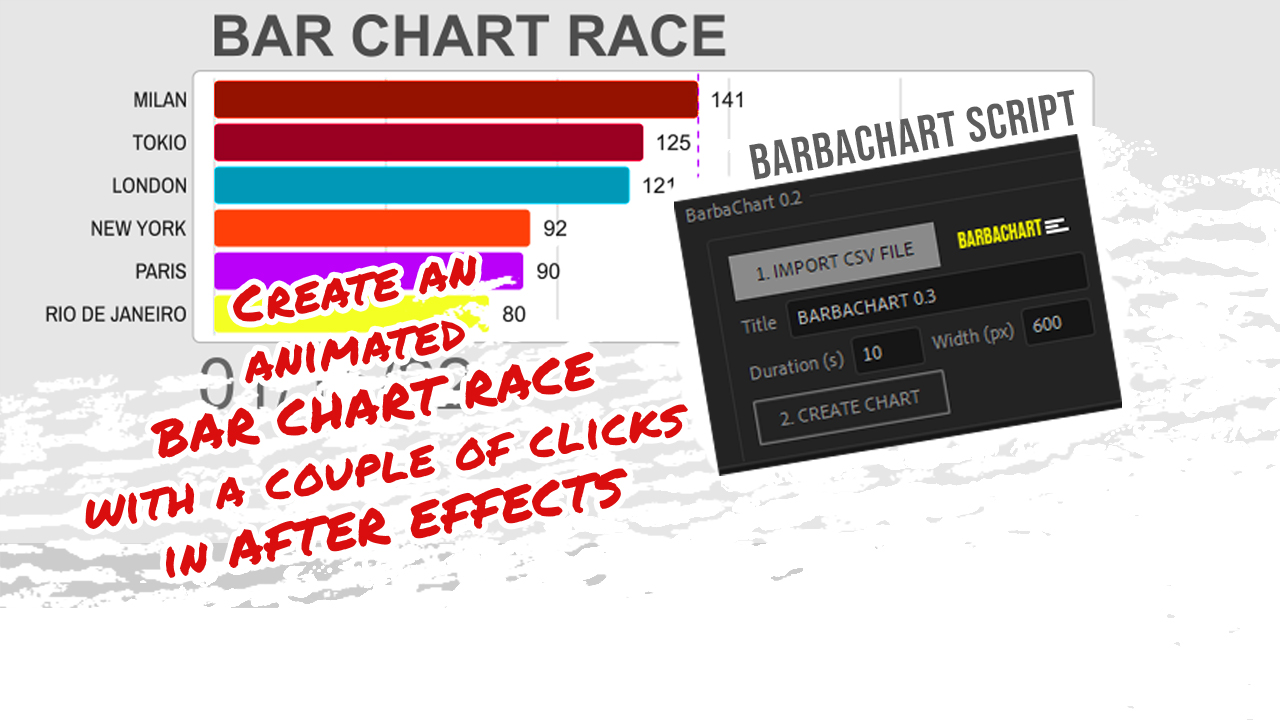 Motion Graphics3 years ago
BAR CHART RACE script for After Effects – BARBACHART