Connect with us

Motion Graphics

After effects video with disappearance

Published

on

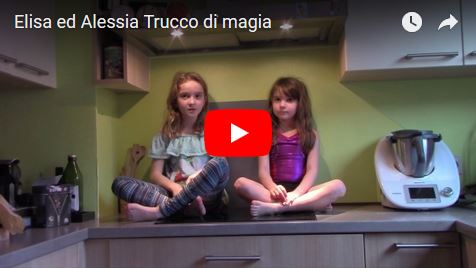
What can you do during a rainy weekend with your daughters?

A short movie of course, where the girls are two skilled sorceress able to disappear and reappear elsewhere.

The disappearing effect has been done in After Effects, using masks in the post-production phase.

Continue Reading
Click to comment

Leave a Reply

Your email address will not be published. Required fields are marked *

Motion Graphics

The 2025 EV Market Shake-up: Visualizing the Data Story

Published

on

By

If you’ve seen my latest DataViz video on YouTube, you’ve witnessed the dramatic “changing of the guard” in the global electric vehicle market. In just four years, the landscape has shifted from a one-horse race to a multi-front technological battle.

A Market in Motion

The data doesn’t lie: by the end of 2025, the rankings we once knew were completely upended. BYD has officially accelerated past Tesla in total volume, while tech giants like Xiaomi have achieved the impossible—moving from zero to over 400,000 units sold in their debut year.

But presenting this data as a static spreadsheet doesn’t do it justice. To truly feel the momentum of these brands, you need to see the movement. That’s why I used an animated stream graph to tell this story. It allows viewers to see not just the final numbers, but the velocity of the growth.

Behind the Scenes: Data Story Maker for Premiere Pro

A lot of you have asked how I created these complex animations. The secret is my own tool: Data Story Maker.

I developed this plugin because I was tired of wrestling with manual keyframes every time a dataset updated. With Data Story Maker, I created the entire stream graph directly inside Adobe Premiere Pro.

What makes it a game-changer for editors?

  • Native Integration: You never have to leave Premiere Pro or After Effects. Everything happens on your timeline.
  • Massive Library: There are tens of animated charts and graphs ready to use, including Racing Bar Charts, Line Charts, Bubble Charts, and the Stream Graphs you saw in my video.
  • CSV Driven: Simply import your data, and the plugin handles the animation. If the numbers change, you just hit regenerate.

Whether you are a professional motion designer or a video editor looking to add broadcast-quality infographics to your projects, this tool is designed to save you hours of work.

Start Telling Your Own Data Stories

Data is the most powerful storytelling tool we have, provided we make it easy for the audience to digest. Don’t let your insights get lost in a static slide.

Ready to level up your video editing game?

👉 Visit the Data Story Maker Shop to explore the full plugin and start creating your own animated visualizations today.

Continue Reading

Motion Graphics

BAR CHART RACE script for After Effects – BARBACHART

Published

on

By

You need to create a Bar Chart Race in After Effects, but have no idea where to start from, or may be you just have no time to create it!

Well, I have you covered: I have developed the right After Effects script for you. Easy!
You will only have to click a couple of times to create a composition containing a working Bar Chart Race.
After that, you can directly use it or customise it to your needs.

Continue Reading

Motion Graphics

Two more Christmas Animations and Happy New Year After Effects Videos

Published

on

By

Christmas illustration

I have been pretty productive last december, mainly because I wanted to experiment some animation ideas in Adobe After Effects.

The first is the one I prefer: it started by wanting to have some fun with the new tape properties in After Effects 2021. The first Christmas tree grows by animating the end of a line shape layer. The width varies along the length using the tape properties.

I have also used the a lot the internal Particle effects in AE. in the first shot, the origin of the particles is even linked to the moving end of the Christmas tree layer.

The second part is the darkest one, where the corona virus is killed by the vaccine. Here I just tried to transmit the creepiness of the situation and the fatigue of the scientists, who finally achieve the goal of killing the virus.

The third scene is where Santa is coming back, using the CC Scatterize effect, and wishes a safer 2021 to everybody 😉

This is the tutorial I made, where I am going through most of the main issues I had to face during the realization of the video:

The second one was inspired by a tutorial I found for recreating fake 3d tape animations, so I came up to use the 3D tape to build a very stylized Christmas tree.

Let me know what you think about these videos in the comments on youtube! I try to answer all comments :=p

Continue Reading

Trending

Copyright © 2017 Zox News Theme. Theme by MVP Themes, powered by WordPress.